
Grade 7 Math students spent the past two weeks working on a survey project, with each student picking a topic of interest, creating a survey based around this topic, collecting data from the school community and then analyzing and reporting their results.
They worked through the following steps, using a range of different apps in the process:
- Define research question (Google Docs)
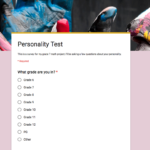
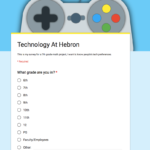
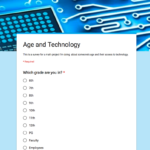
- Create survey (Google Forms)
- Distribute survey (Gmail)
- Data collection (Google Sheets)
- Data manipulation (Google Sheets)
- Data analysis (Google Sheets)
- Report findings (Google Docs)
Creating Google Forms and working with data in a spreadsheet were brand new skills for most of the students, which we took even further by creating custom templates when designing the surveys and manipulating the data collected using calculations and formula. The students also created several different types of charts and presented their findings to their classmates.
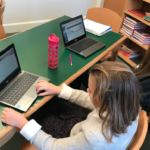
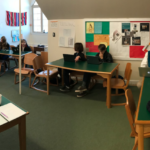
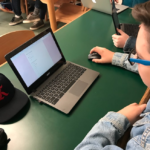
Here are some screenshots of their surveys and photos of the students working hard on their Chromebooks:
And a selection of their finished reports are embedded below (click the square icon in the middle to view the documents full screen):